Monthly Archives :

May 2017

Scheduling – Who does What by When?

Scheduling – Who does What by When? 300 184 Eric Roulo

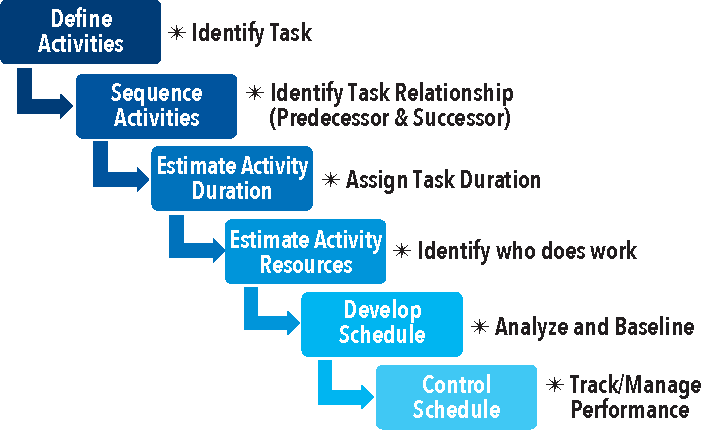
Schedule management is easy to implement when it’s done right, otherwise get ready to do multiple re-baselines. The process is similar wherever you look, including NASA schedule management guidelines, DoD Program life cycle guidelines, or Project Management Institute.  Figure 1 illustrates the six steps: define activities, sequence activities, estimate activity duration and resources, develop schedule, and control schedule.

“The purpose of schedule management is to provide the framework for time-phasing, resource planning, coordination, and communicating the necessary tasks within a work effort.” NASA Schedule Management Handbook

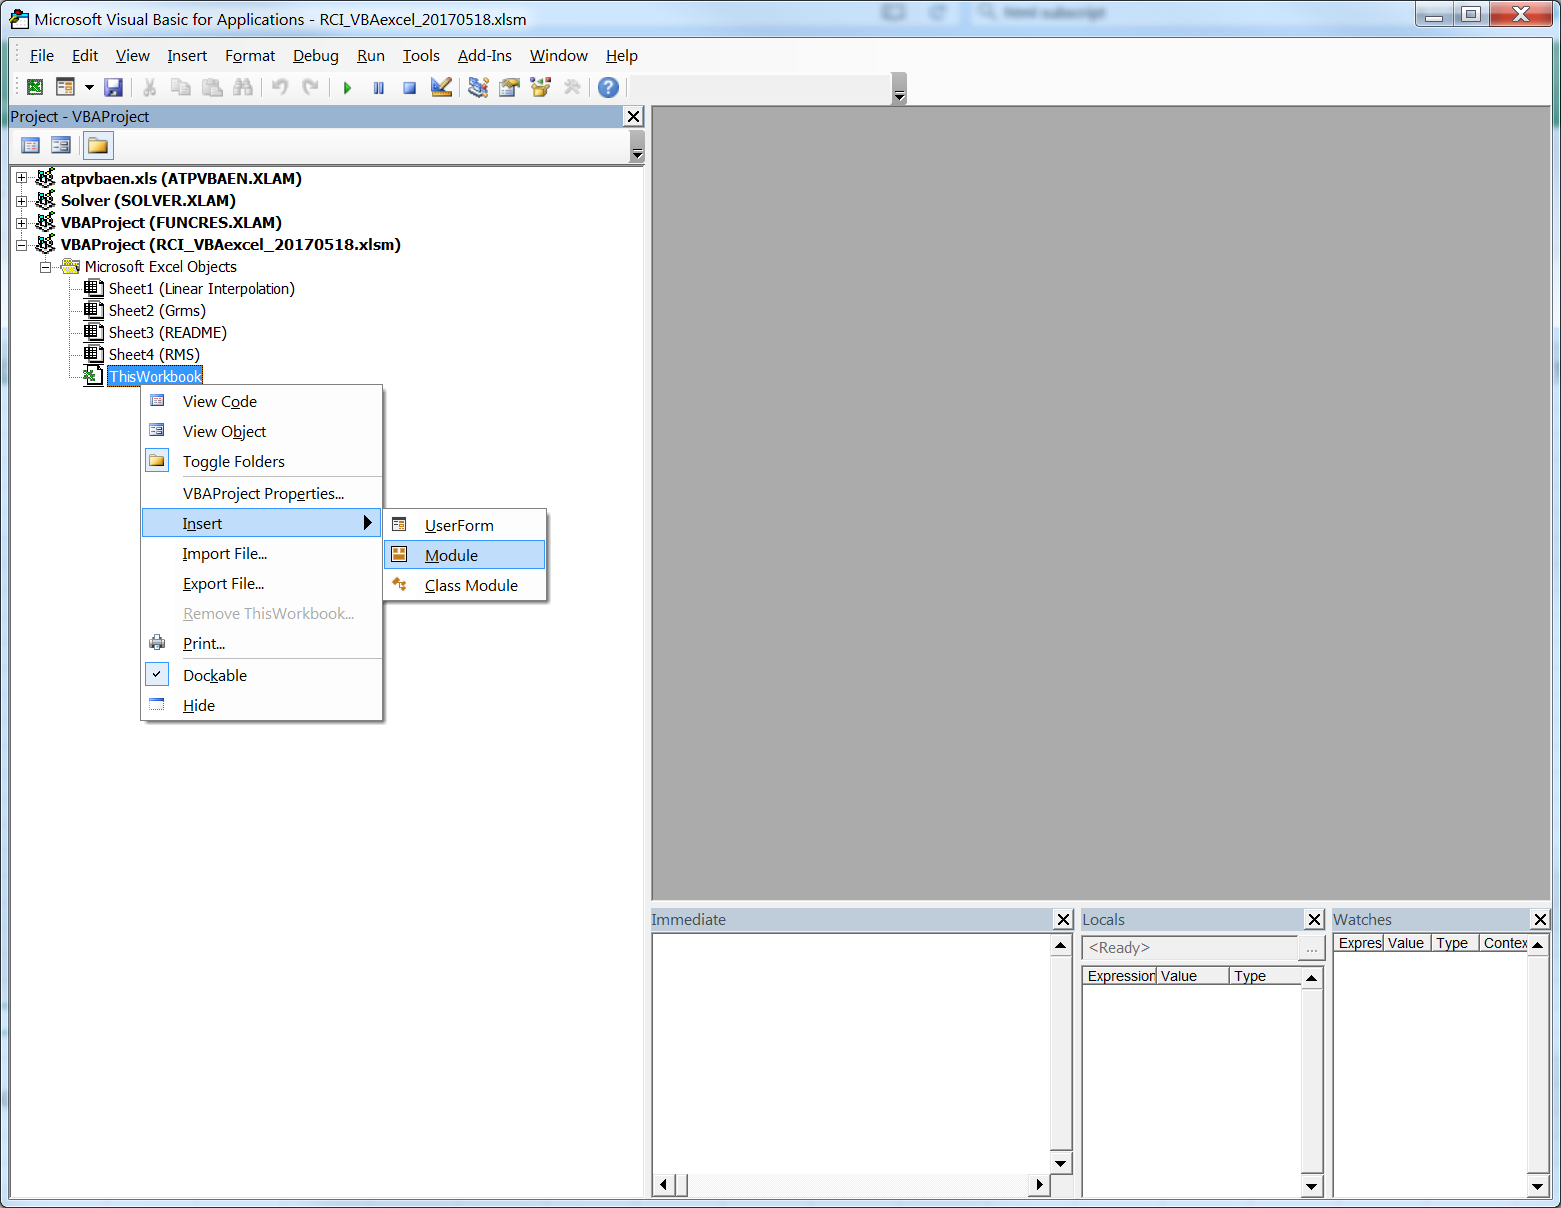
In practice schedule is usually developed using Microsoft Project; however, it can be done in Excel depending on the size of the project. Understanding the concepts of scheduling is critical and can be done successfully in Excel if it is implemented correctly. (I would recommend Microsoft Project to take advantage of built in capabilities to easily develop and control schedules.)

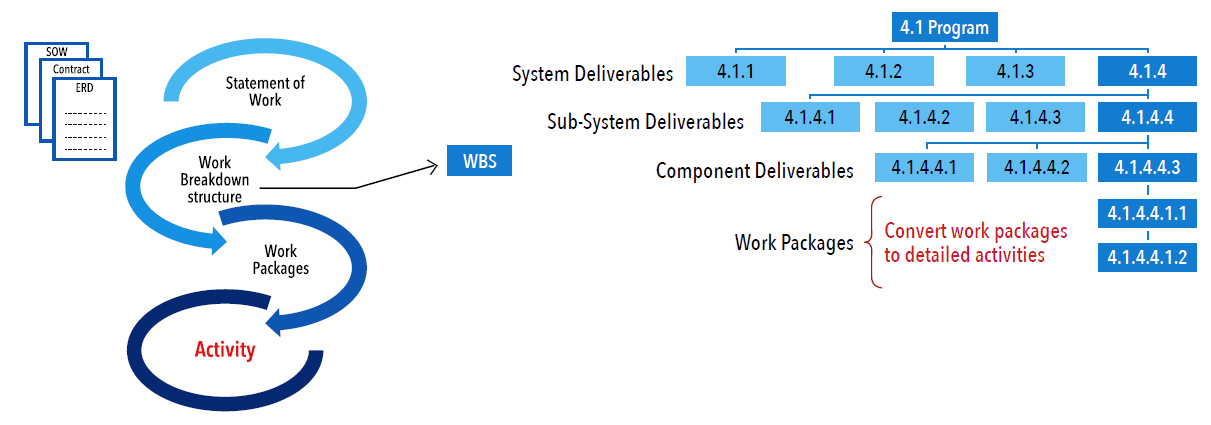
Step 1: Define activities means identifying tasks. Of all the six steps this is the most critical step and worth spending time to understand what the customer really wants and when the product or services are required. Usually as a project manager when contract is given to you, you have better understanding of what needs to be delivered and you are working with your team to tailor out the detail activities. However, I would recommend to start with contract/statement of work then break down the deliverables using Work Breakdown Structure (WBS) process and identify detail activities through work packages. Work breakdown structure divides project Statement of Work to manageable activities, making it easier to supervise and estimate see Figure 2


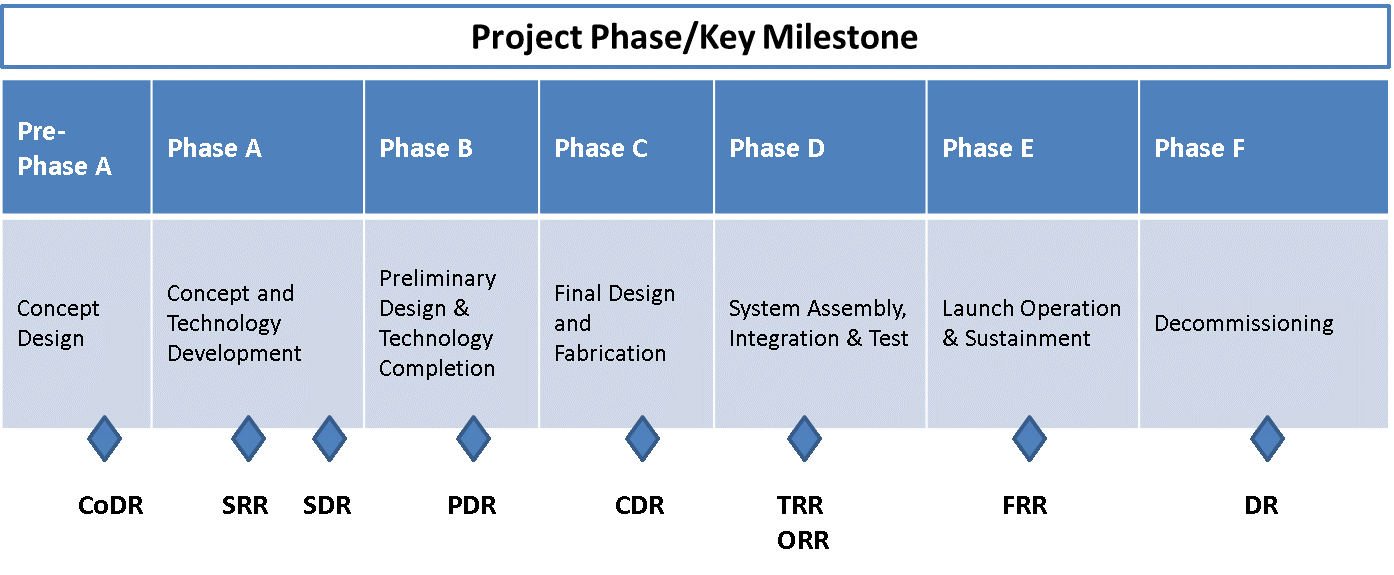
Key project milestone can also help with identifying activities and timeframe. Depending on current phase of your project, you can detail out next 6 to 12 months of schedule activities in Rolling Wave Plan and rest in planning package. Rolling Wave Plan is where near term work is planned in detail and distant work is kept at a higher level. Planning package includes scope to be completed but no activities. Keep in mind near-term typically implies 6 to 12 months from the current date.

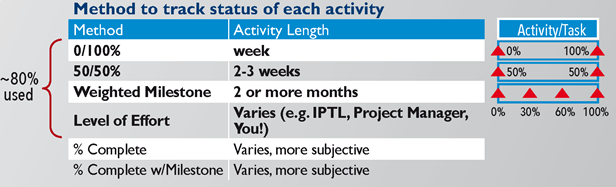
Once the activities are identified consider time frame for each activity to track earned value. You don’t want to identify one activity that will take 6 months or more, it will be hard to measure progress of that particular task. Level of details is needed to analyze if you are behind, ahead, or on schedule. If activity is one week or less, then consider 0/100% method. See Figure 3 for other possible methods track status. Also, estimating duration of activity explained in details in step3. Earned Value Management Systems article.

Summary of step 1. Identify activity through work breakdown structure and define timeframe using earned value method to track status.

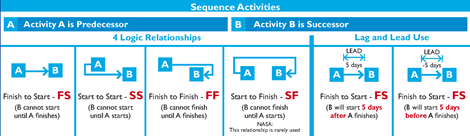
Step2: sequence activities – identify task relationship. I cannot explain any simpler then in the figure below.

-npp

Great Engineers Program – VBA tutorial for Excel

Great Engineers Program – VBA tutorial for Excel 600 374 Eric Roulo

Introduction

Programming is one of the few skills that separates great engineers from merely good ones. Programming is also the best tool I’m aware of for teaching one of the three most important traits of great engineers, curiosity (the other two are being hungry and having enough talent). The value of programming is indisputable however, the barrier to entry is fairly high. Which language should you learn? What exactly will you do with it? Will your manager accept that you’re not, ‘doing your job’ while there is a text editor up with strange syntax up on your screen for hours a day? (Are you programming an iPhone app on company time?!) I have programmed and been exposed to these obstacles for 14 of my 16 years as a mechanical engineer. I have some recommendations:

  • There is no one best software tool, so don’t spend too much time trying to find the holy grail of technical computing.
  • Using open source software will avoid having to ask permission to purchase a software language and makes it easier for others to adopt your software.
  • Accessing the data directly removes the tie to specific pre/post processors that may not be available at your next job.
  • Break the rules in the interest of speed.
  • Good open source languages (Perl, Python); Good Engineering Languages (Matlab); Good development tools (MathCAD).

I recommend starting with VBA (Visual Basic for Applications) for Excel. If you are new to programming it offers many attractive features. You already use Excel, it comes installed with your computer and everyone’s computer you interact with. It expands Excel to do unique things that every engineer in your organization could benefit from. You will immediately be able to program one to ten line programs that have real-world utility. The user base is huge, “googling it” will likely find you someone who has already solved your problem. It’s object-oriented, so if you’re inclined you can add these skills to your repertoire.

Because I’m such a believer in this approach, there will be regular tutorials on using Excel to enhance your engineering productivity. I expect this to evolve over time into more complicated programming languages and techniques, but also provide that *introduction* level exposure to get more people in the field of engineering programming.

Adding UDF’s to Excel

Let’s start, here are three functions that highlight what can be done in just a few lines of VBA.

Download the excel workbook with demo’s here.

The easiest thing to program in VBA is a User Defined Function (UDF). Let’s start with one that computes the root sum of squares of a range of values.

To add user defined code into an excel spreadsheet, we first to need to add a VBAProject ‘module’ into the excel workbook. Enter the VBA editor by typing Alt-F11 from Excel. On the left side of the window, right-click This Workbook->Inset->Module. This will create a window where you can enter VBA code that can be accessed from excel worksheets.

Now we can start typing code. To add a function, type the function (or cut and paste).

1. RSS (Root sum of the squares of a range)

Public Function RSS(Table_array As Range)
' Written by Eric J. Roulo
' Copyright (c) 2017, permission to use is granted if this header is maintained
' Example of using internal VBA command (Sqr) and Excel function (SumSq) to accomplish
' root-sum-of-squares function in one simple call
RSS = Sqr(Application.WorksheetFunction.SumSq(Table_array))
End Function

2. Grms from a range of frequency amplitudes (Dave Steinberg Method)

Public Function grms(Table_array As Range, Optional column As Integer = "2")
' Copyright (c) Roulo Consulting, Inc. 2017
' This function calculates the area under a random vibration input spectrum per
' the method described in Dave Steinberg's "Vibration Analysis for Electronic Equipment"
' 3rd edition, page 195
'
' Instructions for use:
' Input a range where the first column is frequency and the second column is amplitude
' Such as the table below from GEVS-SE Table 2.4-5 "Component Minimum Workmanship
' Random Vibration Test Levels 45.4-kg (100lb) or less"
' [REF  http://arioch.gsfc.nasa.gov/302/gevs-se/toc.htm]
'
'     Freq |  Amplitude  |
'     --------------------
'     20   |     .01     |
'     80   |     .04     |
'     500  |     .04     |
'     2000 |     .01     |
'
'  overall Grms = 6.789
'
' Where Amplitude is in [g^2/Hz]
'
' The grms function will return values that are consistent with the units of the amplitude.
' If your amplitude values are in [(m/s^2)^2/Hz], then your returned rms value will be [m/s^2]

' Written by Eric J. Roulo
' Copyright (c) 2004, permission to use is granted if this header is maintained
' Roulo Consulting, Inc. / www.rouloconsulting.com
' eric.roulo@rouloconsulting.com
' (650) 580-1745

Dim Number As Double
Dim dB As Double
Dim octaves As Double
Dim S As Double
Dim P2 As Double, F2 As Double, F1 As Double

' Where:
' Number  = number of rows in range supplied. This represents the number of freq/amplitude data points
' dB      = the decibel value between two consecutive data points
' S       = the
' octaves = the number of octaves between two consecutive frequencies
' P2      = amplitude (power) at frequency point
' F2      = frequency at high end of two consecutive points
' F1      = frequency at low end of two consecutive points
' column  = the column in the input range with the amplitude. It defaults to 2 without entry. Sometimes the
'           amplitude column is separated by the frequency column and this needs to be adjusted
Number = Table_array.Rows.Count
For i = 2 To Number
P2 = Table_array(i, column)
F2 = Table_array(i, 1)
F1 = Table_array(i - 1, 1)
dB = 10 * Log(Table_array(i, column) / Table_array(i - 1, column)) / Log(10#)
octaves = Log(Table_array(i, 1) / Table_array(i - 1, 1)) / Log(2#)
S = dB / octaves
    If S <> -3 Then
    A = A + (3 * P2) / (3 + S) * (F2 - (F1 / F2) ^ (S / 3) * F1)
    End If
    If S = -3 Then
    A = A - F2 * P2 * Log(F1 / F2)
    End If
Next
grms = Sqr(A)
End Function

3. Linear Interpolation (from the internets)

Public Function LInterpolateVLOOKUP(sLookup_value As Single, rTable_array As Range, iCol_index_num As Integer)
'A User Defined Function that returns values linearly interpolated "between"
'the points in the lookup table. May also return error values, hence definition as implied Variant
'Created by Myrna Larson
'obtained from Mr Excel by Bruce Mutton July 2001
'Substantially edited and documented by Bruce Mutton July 2001
'I have tryed to emulate the behaviour of builtin Vlookup function
'sLookup_value is the value to be found in the first column of the array.
'               sLookup_value can be a value or a reference
'rTable_array  is the table of information in which data is looked up.
'               Use a reference to a range or a range name, such as Database or List.
'               Values in the first column of table_array must be placed in ASCENDING ORDER:
'               ..., -2, -1, 0, 1, 2, ... , otherwise LInterpolateVLOOKUP
'               WILL NOT give the correct value.
'iCol_index_num    is the column number in rTable_array from which the matching value should be
'               returned. A iCol_index_num of 1 returns the value in the first column in table_array;
'               a iCol_index_num of 2 returns the value in the second column in table_array, and so on.
'               If iCcol_index_num is less than 1, LInterpolateVLOOKUP returns the #VALUE! error value;
'               if iCol_index_num is greater than the number of columns in table_array, LInterpolateVLOOKUP
'               returns the #REF! error value.
'
'If sLookup_value is smaller than the smallest value, or larger than the largestvalue, in the first
'   column of rTable_array, LInterpolateVLOOKUP returns the #N/A error value.
                                          
Dim iTableRow As Integer
Dim vTemp As Variant
Dim dbl_x0 As Double, dbl_x1 As Double, dbl_yo As Double, dbl_y1 As Double
                       
'Deal with obvious user errors
If iCol_index_num > rTable_array.Columns.Count Then
LInterpolateVLOOKUP = CVErr(xlErrRef)
Exit Function
End If
                     
If sLookup_value < Application.WorksheetFunction.Min(rTable_array.Columns(1)) Or sLookup_value > Application.WorksheetFunction.Max(rTable_array.Columns(1)) Then
LInterpolateVLOOKUP = CVErr(xlErrNA)
Exit Function
End If
                       
'Now the real thing
On Error Resume Next
vTemp = Application.WorksheetFunction.Match(sLookup_value, rTable_array.Resize(, 1), 1)
On Error GoTo 0
If IsError(vTemp) Then
LInterpolateVLOOKUP = CVErr(vTemp)
                                       
Else
iTableRow = CInt(vTemp)
dbl_x0 = rTable_array(iTableRow, 1)
dbl_yo = rTable_array(iTableRow, iCol_index_num)
If sLookup_value = dbl_x0 Then
LInterpolateVLOOKUP = dbl_yo
Else
dbl_x1 = rTable_array(iTableRow + 1, 1)
dbl_y1 = rTable_array(iTableRow + 1, iCol_index_num)
LInterpolateVLOOKUP = (sLookup_value - dbl_x0) / (dbl_x1 - dbl_x0) * (dbl_y1 - dbl_yo) + dbl_yo
End If  'sLookup_value
End If  'IsError(vTemp)
End Function

Again all these examples are presented in working form in this excel attachment.

Some Closing Thoughts About Software Languages

You should start learning multiple languages. Get good at one or two first. Start thinking about the future, when you need to do something 1 million times, what will you do? How will you think about it?

Watch this video by Perl creator Larry Wall on Which Five Languages Should you Know. It’s only 6 minutes and will whet your appetite for how you should focus your efforts.

Programming as One of Three Critical Traits of Engineers

Programming is the teachable equivalent to curiosity, and curiosity is the hallmark of great engineers. The reason programming is a teachable equivalent for curiosity is that it forces you to break down any problem into fully understood and logically functionalized code. You can’t program a solution until you understand exactly how the problem works. And understanding everything about how a problem works forces a level of curiosity. The thing about programming is there is a positive feedback loop. When you finish the program, the problem is solved. It solves easily (human effort), repeatably, and quickly. You are free to tackle other challenges. And now that you know how to break down problems, understand them, and then solve them forever, you should be motivated to do it more often.

Coming Soon:

1. Newton Iteration in VBA

2. Updating linear interpolation for log-log, log-linear interpolation

3. A better version of vlookup

-ejr

Design of Aerospace Mechanisms

Design of Aerospace Mechanisms 548 416 Eric Roulo

Download 43 Volumes Now

I have recently had the opportunity to work with some clients who are developing space mechanisms. This is a very specialized field with 60 years of tribal knowledge. When working at NASA I was exposed to the Aerospace Mechanisms Symposium which is the semi-annual gathering for all things space mechanism. It is the best place that tribal knowledge is shared. RCI is now sharing the previous 43 volumes with you! You can download the zip file containing all 43 volumes and the contents of the original 2 CD set The NASA Space Mechanism Handbook and Reference Guide*.

If you are involved in aerospace mechanism design, analysis, or oversight, this data set is the best single source of information in the field. Repeating any of the previously documented failures in mechanism design is inexcusable and extremely expensive. Yes, it won’t be an easy task to review the tens of thousands of pages of literature, but they are in searchable pdf format and come with an index.

One of the early articles that I recommend is a 3 page article by an Air Force Major named James C. McSheery. It’s titled, The Design of Aerospace Mechanisms – A Customer’s Opinion. It’s such a humorous and short piece I use it as one of my first reading/writing assignments in my engineering training program. Read it here.

Another article I recommend that came out of the last symposium in 2016 was this article on how Ti bolts are less tough than their equivalent steel fasteners. This is despite the material properties being almost identical. Shocking.

*These files do NOT contain the NASA Handbook due to its ITAR restriction, but you can request a copy here if you are a US Citizen and in the field.

-ejr

Updated 4/28/2019

The latest volume is here (2018): AMS44

Book Review – Material Selection in Mechanical Design, Fourth Edition

Book Review – Material Selection in Mechanical Design, Fourth Edition 1024 782 Eric Roulo

Material Selection in Mechanical  Design, Fourth Edition, Michael F. Ashby. This book was introduced to me by a materials engineer I’ve been working with recently. It opened my mind on how to select materials based on different performance metrics.

After introducing the concepts of material indices and presenting many families of property selection charts, worked examples are presented to aid the reader in implementing the ideas on their projects. The full spectrum of material properties are used in the examples including thermal conductance, cost, fracture toughness, as well as strength, modulus, and the other usual suspects.

The in-depth conversational explanations of all the parameters you have to take into consideration provides a thoughtful and precise way for an engineer to approach material selection while explaining why floor joists basically have to be made out of wood or steel I-beams. By turning decisions into properties-based material performance indices, the best choice becomes clear and numerically defendable against the usual force of personality arguments.

Below is an example of a strength-density chart of engineering materials with minimum mass design guide lines. I enjoy just staring at this chart and making observations such as how magnesium is solidly in the middle of the composites bubble, and how competitive wood parallel to the grain is.

When looking at more complicated built-up structures, the performance indices highlight the types of materials you should be using. Examples are given in the images below.

The hard copy is better than the kindle version because the graphics are sharper. This is also a book you want to be able to easily browse through. I own both a hard copy and the kindle version because I like having it with me all the time (on my tablet). I bought versions of this in India at a significant discount. Think about buying textbooks when you are in countries that have much lower prices (usually Asia).

This review is for the fourth edition, which I highly recommend. The fifth edition was released this past January, I imagine it’s better. Get it. Read it.

For an extensive preview of the content you will be getting in the book, you can read a collaboration between the author and NASA in TM 2012-217411, Material Selection for Aerospace Systems. It’s awesome, free, and should convince you to purchase the 660 page full version.

The University of Cambridge has also created an online resource that visualizes material data in the way presented in the book. It’s worth taking a look at.

http://www-materials.eng.cam.ac.uk/mpsite/

Interactive material charts are here:

-ejr